Turning Drone Inspections Into Maintenance Intelligence
A map-first platform that aligns HD and thermal drone imagery, orchestrates ML-based grid defect detection, and turns the results into auditable work orders.
Business Need
A UAE energy distribution utility inspects a large network of power lines, poles, and switch assemblies using drone flights that produce paired high-definition and thermal imagery. Reviewing this imagery by hand was slow, hard to standardize, and difficult to trace from a single photo back to a specific asset. The utility needed one secure system to ingest inspection imagery, detect defects with machine learning, and hand the results off to its maintenance workflow without losing geospatial or asset context.
Result
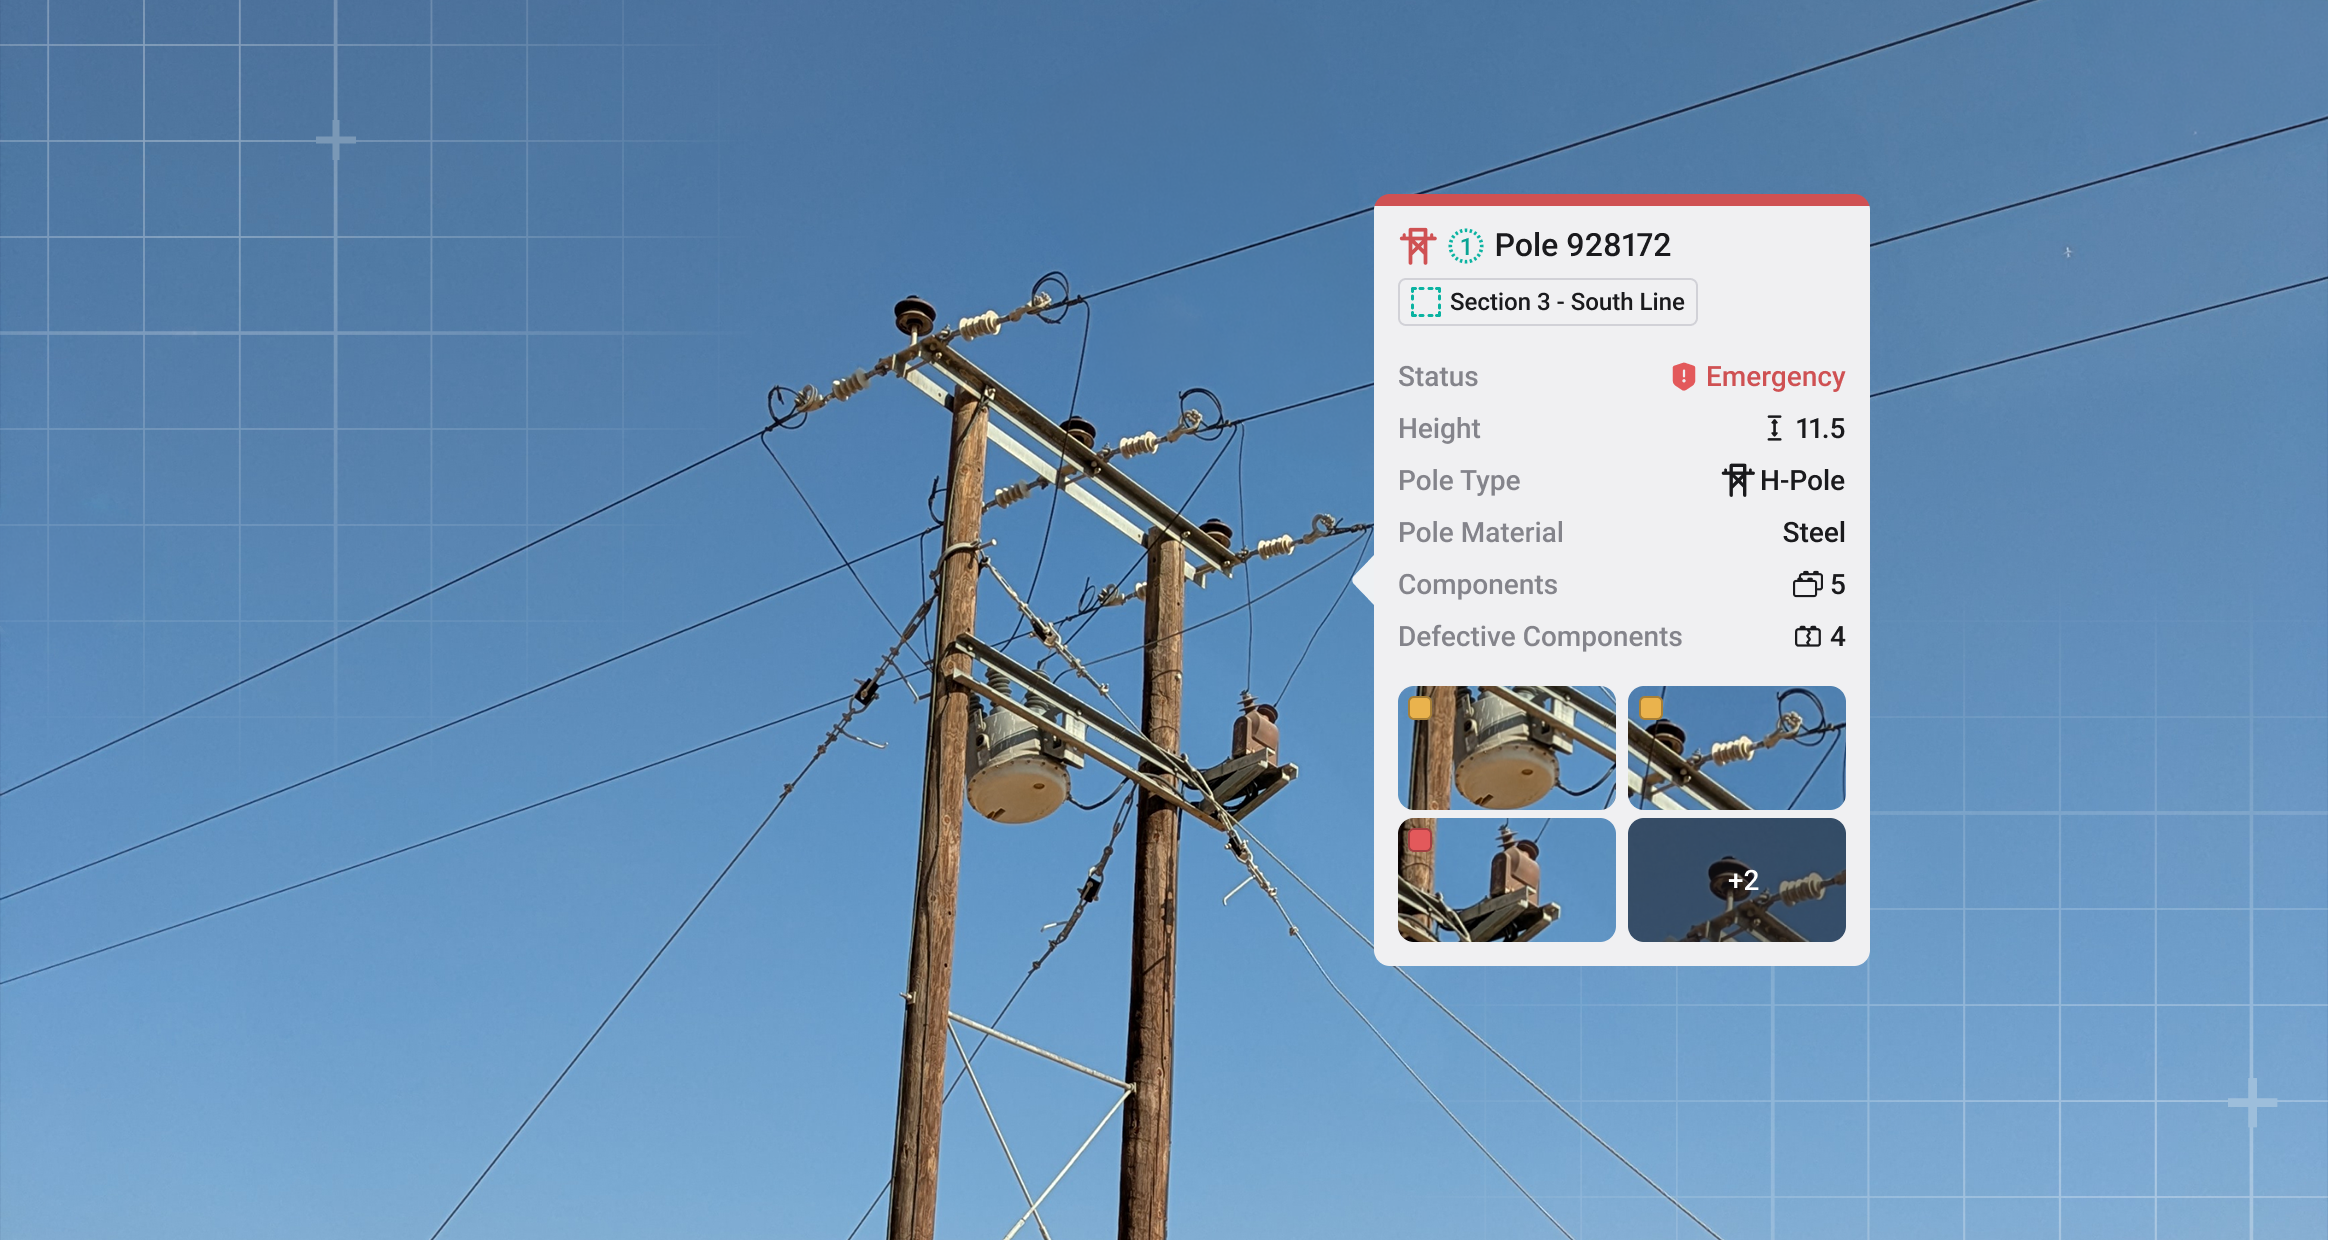
We delivered a production-ready web platform that streams paired drone imagery into the cloud, aligns HD and thermal frames, tags each image to the correct pole, and orchestrates ML detection for components, defects, and thermal hotspots. Inspections now flow through explicit, auditable status stages into PDF, JSON, and Excel exports and an IBM Maximo work-order pipeline, with a feeder analytics dashboard giving operations a live view of network health.
From Thousands of Drone Images to Actionable Defects
A power distribution operator runs regular drone inspections across its grid, capturing paired imagery for every asset: a high-definition photo and a thermal photo of the same pole and its components. The raw output is large and unstructured. Inspectors had to manually correlate HD and thermal frames, decide which pole each image belonged to, identify defects by eye, and then re-enter findings into maintenance systems. The process did not scale, was hard to standardize across teams and regions, and broke the chain of traceability between a photographed defect and the physical asset it came from.
The client needed a single secure platform to absorb this imagery, apply AI for detection, and preserve full context from the image canvas all the way to the maintenance work order.
Key items:
- Paired HD and thermal drone imagery captured per asset
- Manual, error-prone correlation of images to poles
- No standardized, auditable path from defect to work order
- Geospatial context lost between field capture and maintenance handoff
Orchestrating an AI Pipeline at Scale
The defect-detection models themselves were provided by a dedicated ML team. Our role was to build the infrastructure and platform that make those models usable in production: the ingestion, orchestration, and integration layer that turns raw drone uploads into structured, reviewable results. We engineered an asynchronous, callback-driven processing pipeline on GPU-enabled Azure infrastructure, wiring each ML service into the platform through webhook and task-callback contracts so processing runs off the request thread and partial results stream back as they complete.
A consistent file-naming standard underpins the automation, letting the system pair each HD image with its matching thermal image reliably. On upload, the platform streams files into Azure Blob Storage, then orchestrates pre-processing and queues the ML work through Azure Queue Storage and Celery-based workers. We built the orchestration around four integrated services: HD-Thermal Alignment, which aligns each thermal image to its HD pair; Image-to-Pole Tagging, which uses map geometry and image location data to assign every image to the right pole; Component and Defect Detection, whose results the platform ingests, deduplicates, and groups into report-ready entries; and Thermal Hotspot Detection, which surfaces temperature readings for thermal findings. Our infrastructure handles staging, retries, per-image error reporting, and ingestion of these outputs, so inspectors can start reviewing immediately while later results are still arriving.
A Map-First Web Application
The map is the primary workspace. Built with React 18, TypeScript, deck.gl, and MVT vector tiles with the Google Maps API, it gives inspectors GIS layers, pole and device filters, clustering, fast search by asset code or coordinates, and measurement tools. The platform automatically links poles and devices to their network lines, with manual fixes available for edge cases. Inside the viewer, inspectors compare HD and thermal evidence side by side with an aligned split slider and a pinned map pane, while defect markers and archive logs stay in sync, so closing or reopening an issue keeps a clean, traceable history. The NestJS and Node.js backend handles business logic, with MongoDB, PostgreSQL, PostGIS, and Redis behind it, and Azure security controls (Key Vault, Managed Identity, WAF, and role-based access) enforcing protection boundaries.
Reporting, Analytics, and Maintenance Handoff
Detections become deliverables through a reporting engine that previews and exports comprehensive PDFs with cover pages, indexed contents, pole-level sections, defect summaries, and paired HD-thermal thumbnails carrying hotspot temperatures. A "Share" function produces five-day, view-only links for controlled external access. The Work Orders module supports inspection and maintenance orders with explicit status tracking, exports to PDF, JSON, and Excel, and a pipeline built for IBM Maximo submission, with PDFs rendered through Puppeteer and stored in Azure Blob Storage.
Above individual projects, the Feeder Dashboard centralizes operational health with region-grouped feeder lists and six analytics cards, including MTTR comparisons across regions, repair frequency, top defect types, and a Top-10 Defects by MTTR view. Archive logs are authoritative, filterable, linked to work orders, and feed both analytics and audit, giving the utility a measurable, end-to-end picture of how field data becomes maintenance action.
482
Upload images in 1m 27s with full pre-processing
~2.1 images/min
Sustained ML detection throughput
24-hour
Session lifecycle for role-based secure access
4
Azure VMs Production deployment
Gallery


Build a High-Conversion
3D Experience for Your Brand
Let's design a configurator that increases engagement and drives measurable growth.
Recent Experiments
Exploring the future of interactive commerce and WebGL experiences.

Labrador

Simplio

Voxii.ai

Clash of Diggers
Thermogreen